PDF tracking for online publications
Track PDFs online with analytics and heatmaps
Looking for a PDF tracker? FlowPaper Analytics shows sessions, reads, time per page, and external link clicks. Heatmaps add a page-by-page view of where readers interact with your content.
Try it with a PDF See how heatmaps work
What you can track in a PDF publication
Go beyond an open count: compare sessions and reads, see how long readers spend on each page, and check which external links they follow. Heatmaps add a visual view of page activity.
See readership at a glance
Check sessions, reads, and activity over time to see whether a publication is reaching its audience.
Find pages worth a closer look
Use page views and time spent to spot the sections readers stay with and the ones that may need a rethink.
See what readers click
Review external link clicks alongside heatmaps to see how people interact with the content on each page.
PDF heatmaps make page activity visible
Instead of scanning rows of numbers, use a color overlay to see where interactions cluster on a brochure, catalog, or report. It can help you compare content areas and spot sections readers may be passing by.
FlowPaper heatmaps summarize recorded interactions; they do not measure where a reader's eyes are looking.
Read the PDF heatmap setup guideTrack PDF views, reading time, and link clicks
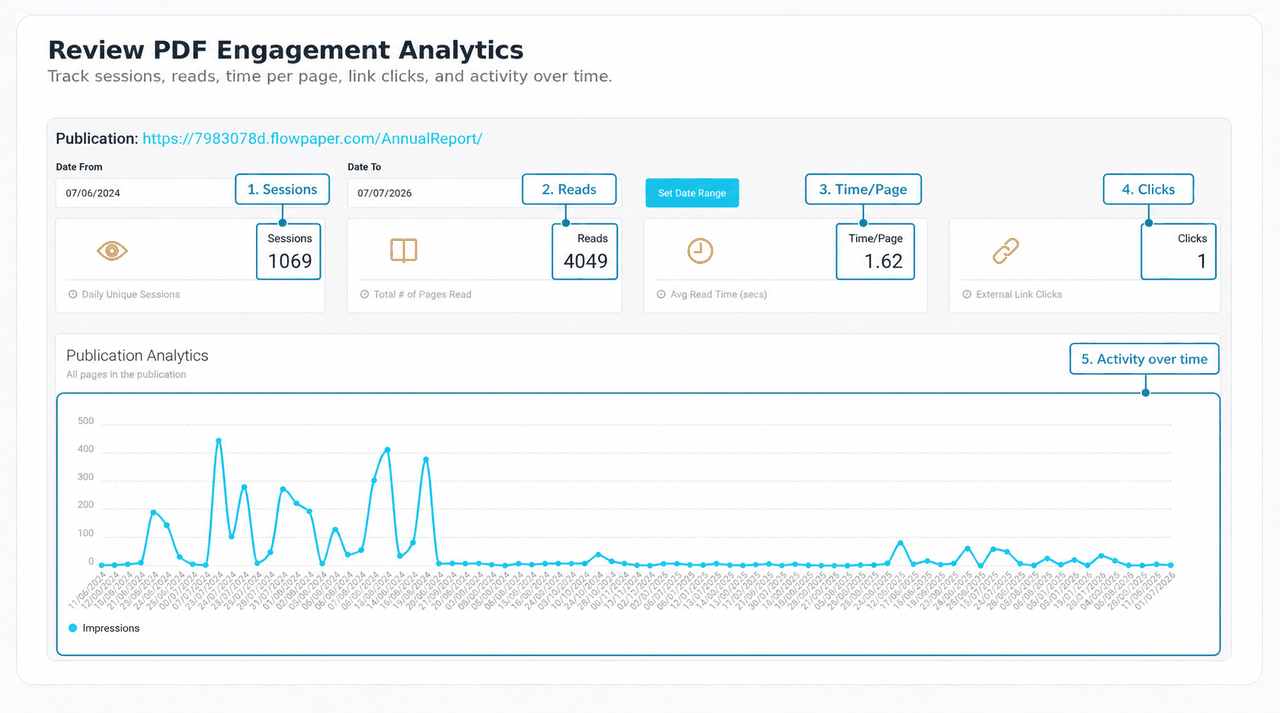
Start with publication-level analytics, then compare pages to see how readers use the document. FlowPaper brings the main PDF tracking measures together:
- Sessions and reads for each publication
- Average reading time and time per page
- Clicks on external links
- Activity over time, with page-level heatmaps
How to start collecting PDF analytics
For heatmaps, publish with FlowPaper Cloud hosting. Then enable collection and check the results in your Account Area.
1. Publish your document
Import your PDF and publish it with FlowPaper Cloud hosting.
2. Turn on analytics
In Settings, enable Collect Analytics and Collect Heatmap Data, apply the settings, and publish.
3. Review the results
In the Account Area, find your publication and choose View Analytics or View Heatmaps.
Questions about PDF analytics and heatmaps
What does a PDF heatmap show?
It uses color to summarize recorded interactions on each page. It can show which areas are more active, but it does not track eye movement.
Can I track a PDF online?
Yes. FlowPaper Analytics records sessions, reads, time per page, and external link clicks for online publications. For recipient-specific tracking, see individual PDF tracking links.
Do I need FlowPaper Cloud?
Yes. Heatmap collection requires FlowPaper Cloud hosting. Follow the setup guide to enable it.
Make your next PDF publication a little less guesswork
Publish with FlowPaper, then use real reader activity to decide what to improve.
Try FlowPaper with a PDF